Knowledge Management System (KMS) is one of the critical factors for successful organizations. The purpose of KMS is to use the entire knowledge base of the organization, along with “individual skills, competencies, thoughts, innovations and ideas”, to create a more efficient organization.
When it comes to innovation in KMS and associated processes, consulting and professional services firms have been ahead of the curve, as the nature of their business demands.
They have been able to engage and involve everyone on the firm level to contribute to the knowledge as a part of organizational level change. Additionally, they have supported this with smooth and efficient KM processes that make the knowledge contribution method simple and swift. To ensure that the knowledge shared is easy to access and comprehend, they have enhanced user experience using personalization and design thinking techniques, and distributed search engines such as Elasticsearch.
However, assessing ROI or performance of knowledge management systems is still an area less explored as there are no direct cost/benefit relationships. Here in this article, we will highlight the drawbacks of traditional methods and suggest a more objective approach for evaluation of KM performance.
Traditional Metrics and Its Challenges
When assessing the performance of KM systems, firms have relied on the traditional usage metrics (View, Downloads and Click Throughs). These metrics, although useful, only give a shallow picture of the actual benefits. For example, will a user visiting a particular asset page in the KM system help in winning a proposal from a client; how was a downloaded content further utilized and did the user connect with the content author to get more expertise?
Along with metrics, gauging KM performance requires the expertise of knowledge managers or the feedback fro business users within the firm. To identify improvement areas and thus the next focus of investment, firms conduct extensive surveys and user interviews. Either way, the process is insufficient, scattered and costs much.
Approach
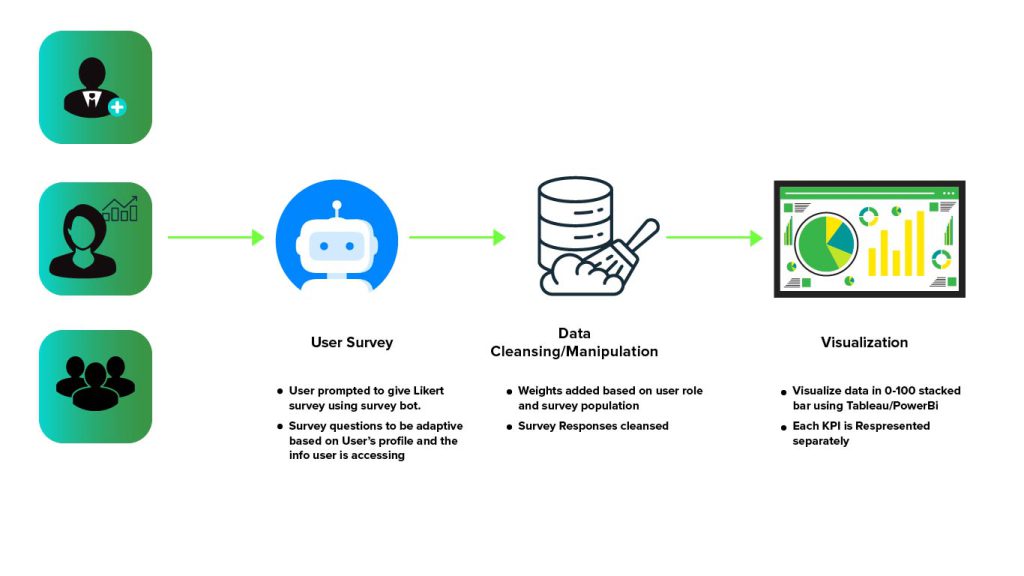
The approach we propose is primarily based on user surveys that rely upon technological solutions as enablers for data collection and representation.
It is a three-step approach – data collection, followed by data cleansing and visualization.

Data Collection
For highly accurate indicators, we need practical survey data. With the help from knowledge managers and leaders, we can single out the KRAs for the KM system. KRAs may not be the same for all firms and depend on the nature of the business. Eg. Below are a few possible KRAs for consulting or professional services firms.
- Ease of contribution/sharing
- KM support
- Value to the organization/client
- Effort saved
- User experience
- Search results and recommendations
- Client acquisition
A pool of questions would then be created for each KRA and included in the survey.
A survey chatbot is a preferred medium for data collection over a traditional online survey form because of its high response rate and higher engagement. Moreover, a rule-based chatbot can prompt survey questions based on the user role, designation, type of content being viewed, industry, etc. Chatbots are cost effective as well.
When it comes to survey techniques, Likert survey is the recommended survey format as it captures the answers in a wide objective range (strongly disagree to strongly agree). It is easy to use, prompts more responses and helps to measure the intensity of the answers compared to binary or subjective surveys.
Data Manipulation
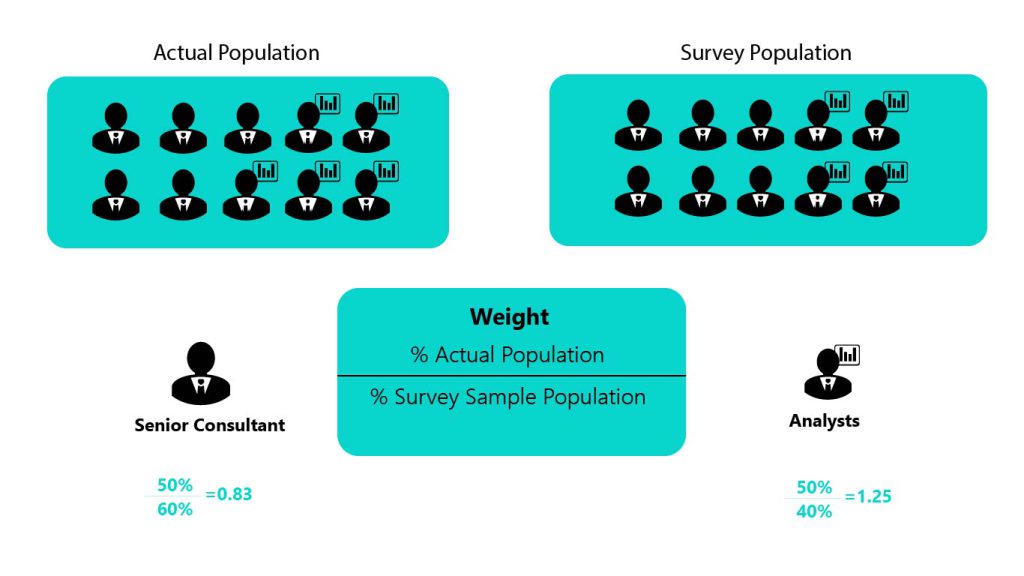
For an effective survey, survey responses should be honest and survey populations should match the actual population. Scenarios such as incomplete survey, quick survey completion and straight-line/unrealistic/inconsistent answers lead to collation of incorrect survey data. We can implement effective solutions to eliminate such responses.
Another important data manipulation technique is adding correct weights to survey responses. Below is one such scenario where the survey population doesn’t match the actual population.

Further weights to individuals’ responses can be added based on the designation, content type of document, etc.
Visualization
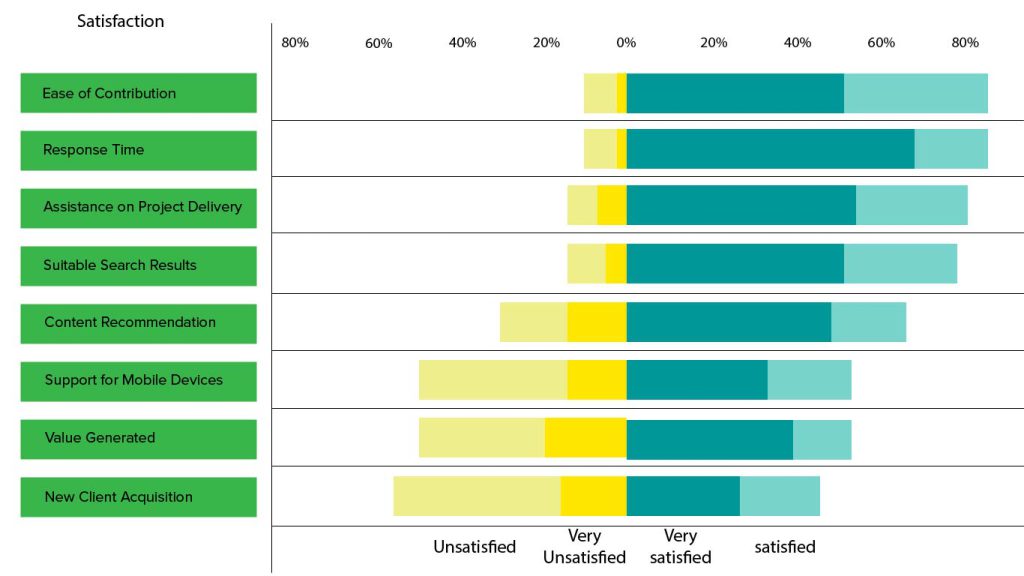
Lastly, for visualization, we need a representation that is not too complex for the decision makers to review and share across. A visual representation, supported by tools like Tableau or Power BI, that makes it easy to identify the leading and lagging areas serves the purpose. Most firms may not have the need for real-time tracking, in which case output could be in the form of periodic visual reports.
The below representations show how Likert survey results for each KRA would look using a divergent stacked bar chart.

Conclusion and Future Scope
The solution described above considers the high-level details required for each step. Each step mentioned has a wide range of possible solutions that can be curated as per firm’s needs and competencies. However, a technical solution alone is not enough. Effective results require an equally effective firm-wide initiative to promote the adoption of such surveys.
Understanding the performance of KM Systems is an unexplored area and there are numerous possibilities for firms to assess returns on them.

is a Lead Business Analyst at Happiest Minds with 9 years of experience in Business Analysis and Product Management in IT services across Retail and BFSI domains with a deep interest in Data Science, Machine learning, and Generative AI.


